Introduction
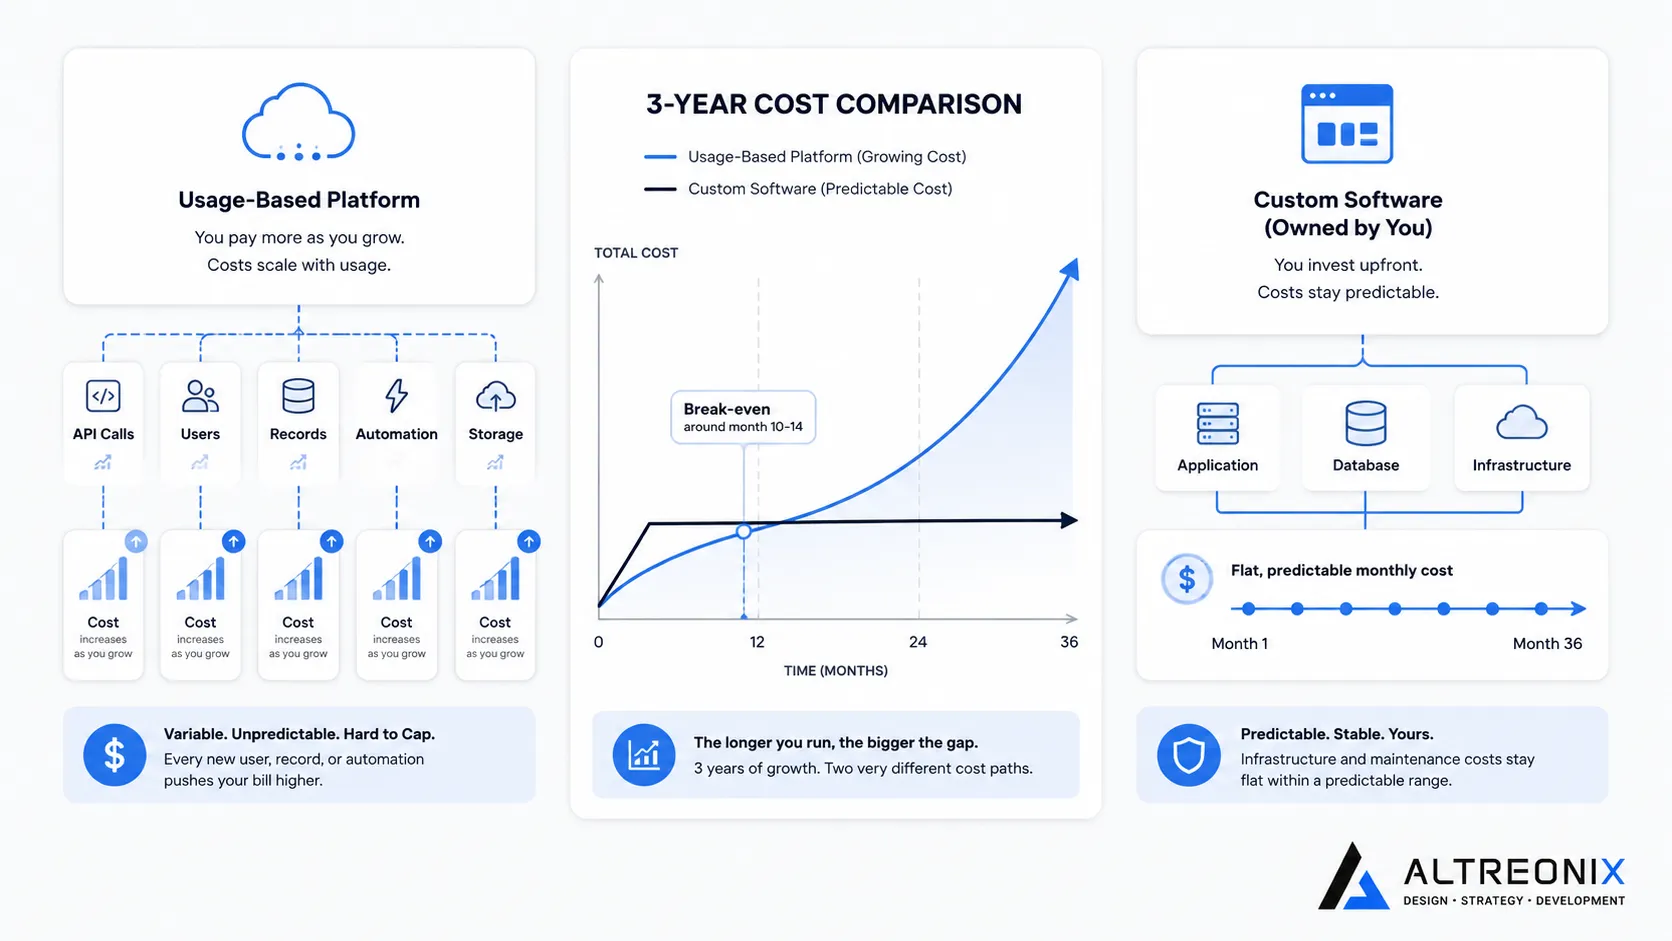
Our pillar post, diagnostic checklist, and technical deep dive covered why businesses outgrow no-code platforms and what actually breaks when they do. This post is about the number that usually decides whether any of that matters to you: cost, tracked honestly, over more than one year.
We pulled real pricing pages, real migration case studies, and one independently documented multi-year cost breakdown to build this comparison, rather than relying on the sticker price most comparisons stop at. The sticker price is almost never the real number, on either side of this decision.
Why This Comparison Is Harder Than It Looks
Most cost comparisons pit a no-code platform’s monthly subscription against a custom development quote, and the custom quote always looks worse, because it’s a large number that arrives all at once. That framing misses two things. No-code cost isn’t the subscription price, it’s the subscription price plus every add-on tool, overage charge, and workaround your team has quietly built around the platform’s limits. And custom software cost isn’t just the build, it’s the build plus flat, predictable hosting and maintenance afterward, compared against a no-code bill that keeps climbing as you grow.
The honest comparison isn’t month one versus month one. It’s total cost over two to three years, tracked the same way on both sides.
What No-Code Actually Costs at Scale
Sticker prices for the platforms in this cluster look modest. Bubble’s pricing page lists plans from $29 a month for a web-only Starter tier up to $349 a month for Team, with Workload Units included and metered overage billed at roughly $0.30 per 1,000 units beyond your plan’s allowance.
That’s not what a real production app actually costs, though. Once plugin subscriptions, Workload Unit overage during traffic spikes, and the developer time spent optimizing around performance limits are counted, independent tracking of live Bubble apps puts realistic monthly cost at $1,500 to $3,500 a month for a genuinely active application, five to ten times the headline number.
The same pattern shows up one layer down, in the backend services many no-code frontends connect to. Xano, a common backend layer paired with Bubble, Webflow, and other no-code frontends, prices its Pro plan at a flat $224 a month regardless of traffic. A comparable workload on a purely usage-metered backend can run considerably higher purely from overage charges once monthly active users climb into the hundreds of thousands, since usage-based pricing has no ceiling on how much a busy month can cost you.
This is the pattern worth internalizing: no-code and low-code pricing is built around metering, records, seats, API calls, workload units, sync events, so the bill is a direct function of your growth, not a fixed cost you can plan around indefinitely.
Here’s how that plays out in realistic monthly cost, once growth pushes past the entry tier, across the platforms covered in this cluster.
| Platform | Entry sticker price | Realistic cost at moderate production scale | What drives the gap |
|---|---|---|---|
| Bubble | $29-$119/mo | $1,500-$3,500/mo | Workload Unit overage, plugin subscriptions, optimization labor |
| Airtable | $20-$45/seat/mo | Scales with seat count plus a separate automation or sync tool once the 5 req/sec API limit is hit | Seat growth and add-on tooling to work around the rate limit |
| Glide | Free-$249/mo | Can spike sharply if syncing frequently with an external source | Update-sync metering, not row count |
| Softr | $0-$269/mo | Forces a full tier jump once records or app users cross a threshold | Flat tiers, no partial upgrade path |
| Webflow | $0-Premium tier | Rises mainly through bandwidth and CMS item add-ons at scale | Traffic and content volume growth |
None of these numbers are meant as a precise quote for your specific app, they’re a directional sense of how far the real cost tends to drift from the sticker price once a business is operating past the early, low-volume stage.
What Custom Software Actually Costs
Custom development has the opposite cost shape: higher upfront, flatter afterward. TechVinta’s 2026 migration guide breaks typical project costs down by complexity. A straightforward single-platform migration, Bubble to Rails for example, runs roughly $15,000 to $25,000. A more involved rebuild, like a marketplace moving to Rails and React, runs $40,000 to $70,000. A full multi-tool stack migration, replacing Bubble, Zapier, and Airtable together, typically lands between $80,000 and $120,000.
Veld Systems puts typical rebuild timelines at eight to twelve weeks and $30,000 to $60,000 for standard applications, extending to twelve to sixteen weeks and $50,000 to $100,000 for more complex systems, broadly consistent with TechVinta’s ranges.
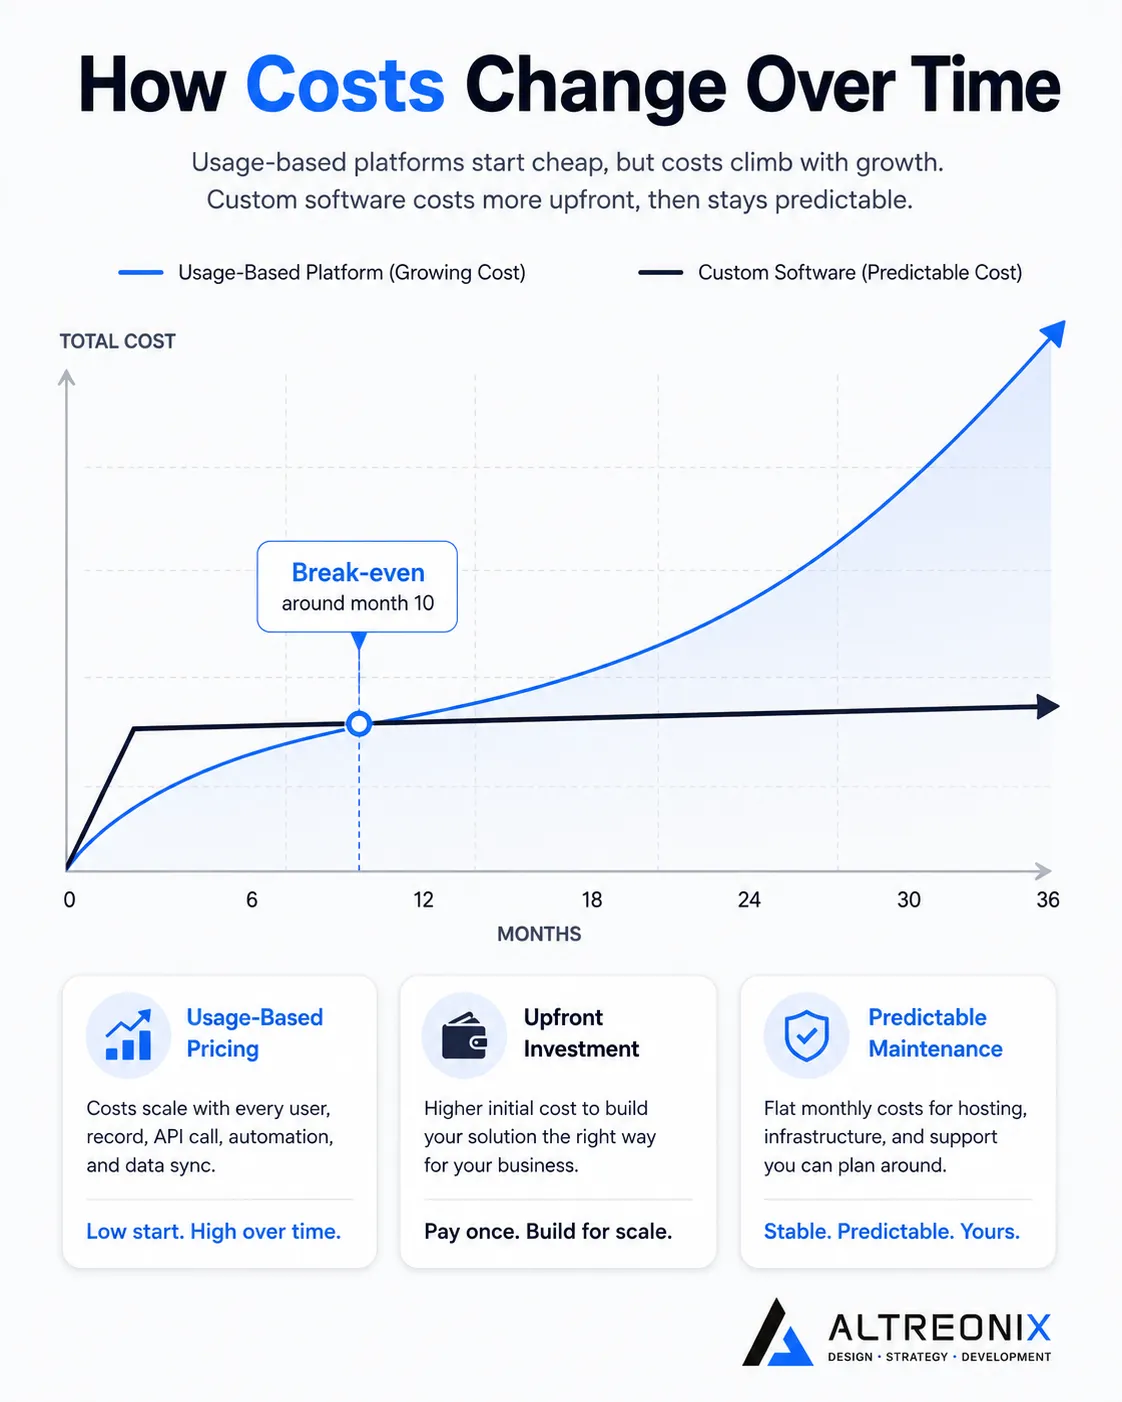 Ongoing cost after the build is the part that actually makes the multi-year math work. Custom infrastructure hosting for a mid-sized application commonly runs $50 to $200 a month, flat, regardless of usage growth within a reasonable range, plus a maintenance retainer, commonly a few hundred dollars a month for ongoing support and small fixes, rather than a bill that scales directly with every new user or record.
A Real Multi-Year Cost Comparison
Rather than build a hypothetical model, it’s worth walking through a documented one. DBB Software’s case study on a client migration from Bubble lays out real year-by-year numbers.
| Year 1 | Year 2 | Year 3 | |
|---|---|---|---|
| Staying on Bubble | $13,188 | $13,188 | $39,564 (usage growth) |
| Migrating to custom | $37,200 (migration + maintenance) | $7,200 (maintenance only) | $7,200 |
The custom path costs more up front, migration plus a full year of maintenance adds up to more than double a year of staying on Bubble. But the crossover happens fast. By this case’s own numbers, cumulative Bubble costs catch up to the custom path’s higher year-one investment around nine to ten months in, and every year after that, the gap compounds in the custom path’s favor as Bubble’s usage-based costs continue climbing while custom hosting and maintenance stay flat.
This specific case involved a business with real, ongoing usage growth, which is exactly the scenario where the math works out this way. A business with genuinely flat, low usage would see a much longer, or nonexistent, crossover point, which is precisely why this decision has to be run on your own numbers, not borrowed from someone else’s case study.
The Hidden Costs No Pricing Page Shows You
The biggest gap between sticker price and real cost usually isn’t the core platform, it’s what gets bolted on around it. A commonly cited real-world example describes a business running a full no-code stack, a core platform plus a backend service, a membership tool, an automation layer, and separate messaging and email providers, where the combined monthly bill across every tool added up to several times the core platform’s own line item once everything was actually totaled.
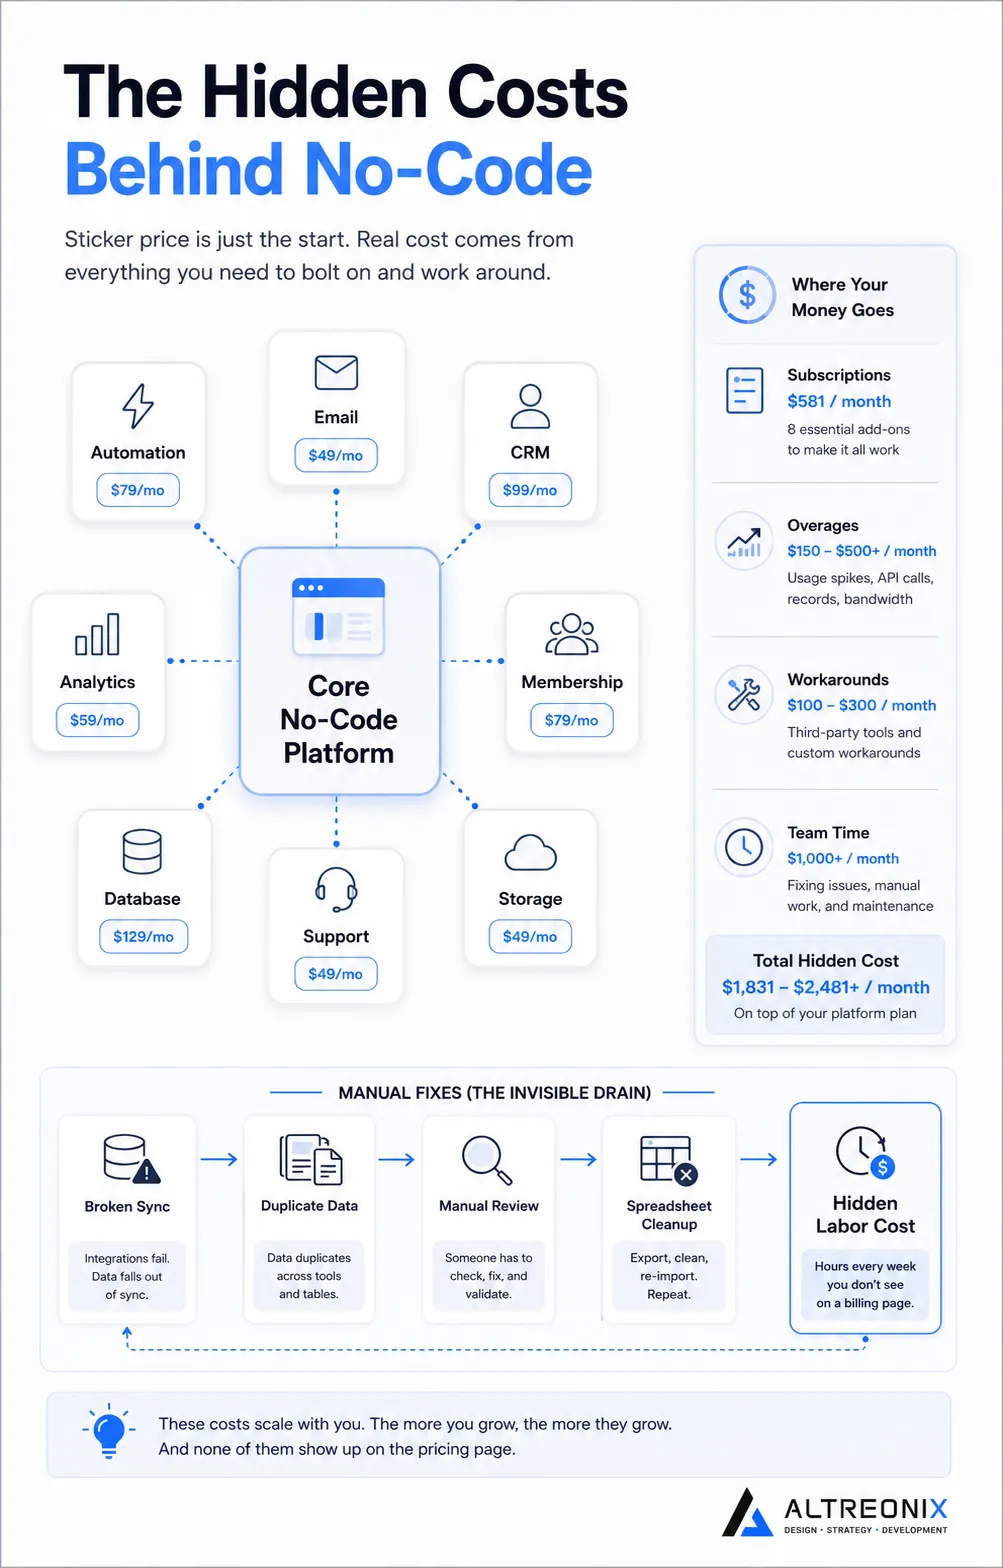 The less visible cost sits in labor, not subscriptions: the hours a team spends manually reconciling data between tools when an integration fails silently, or working around a workflow the core platform can’t handle natively. That time rarely gets logged as a cost anywhere, which is exactly why it’s so easy to underestimate the true price of staying on a fragmented no-code stack.
The Opportunity Cost of Your Team’s Time
There’s a cost category that never shows up on an invoice at all: what your team could have been doing instead of firefighting a workaround. Every hour spent manually re-entering data because a Zapier automation failed silently, or rebuilding a broken integration after a plugin update, is an hour not spent on product, sales, or the actual work that grows the business.
This is genuinely hard to put a precise number on, and we won’t pretend otherwise. But it’s worth estimating even roughly. If someone on your team spends even three or four hours a week on this kind of maintenance, at a fully loaded cost of $40 to $75 an hour depending on role, that’s $500 to $1,200 a month in labor that a flatter, better-architected system wouldn’t require. Add that to the subscription totals above before deciding whether the no-code path is really cheaper, because on paper it often looks that way specifically because this number is missing.
When the Math Actually Favors No-Code
It’s worth being fair to the other side of this. Forrester’s Total Economic Impact study of Microsoft Power Apps, a low-code platform, found a composite organization realized $46.1 million in benefits against $15.1 million in costs over three years, a 206% ROI. That’s a real, methodologically documented result, and it matters as a counterweight to treating no-code as automatically a bad long-term bet.
It’s worth noting, as with any vendor-commissioned Total Economic Impact study, that these figures come from interviews with a small number of the vendor’s own customers, assembled into a composite case, so they represent a best-case outcome rather than a typical one. The honest reading is that no-code and low-code adoption absolutely can deliver strong ROI, specifically for the kinds of use cases, internal tools, departmental workflows, and applications with bounded, predictable usage, where a platform’s usage-based pricing never gets pushed hard enough to spike, and where the cost of a custom build would exceed the problem’s actual size.
The math tips toward custom software specifically when growth is real and ongoing, which is the exact scenario the DBB Software case above illustrates, and the exact scenario our diagnostic post walks through how to recognize in your own numbers.
How to Run This Math for Your Own Business
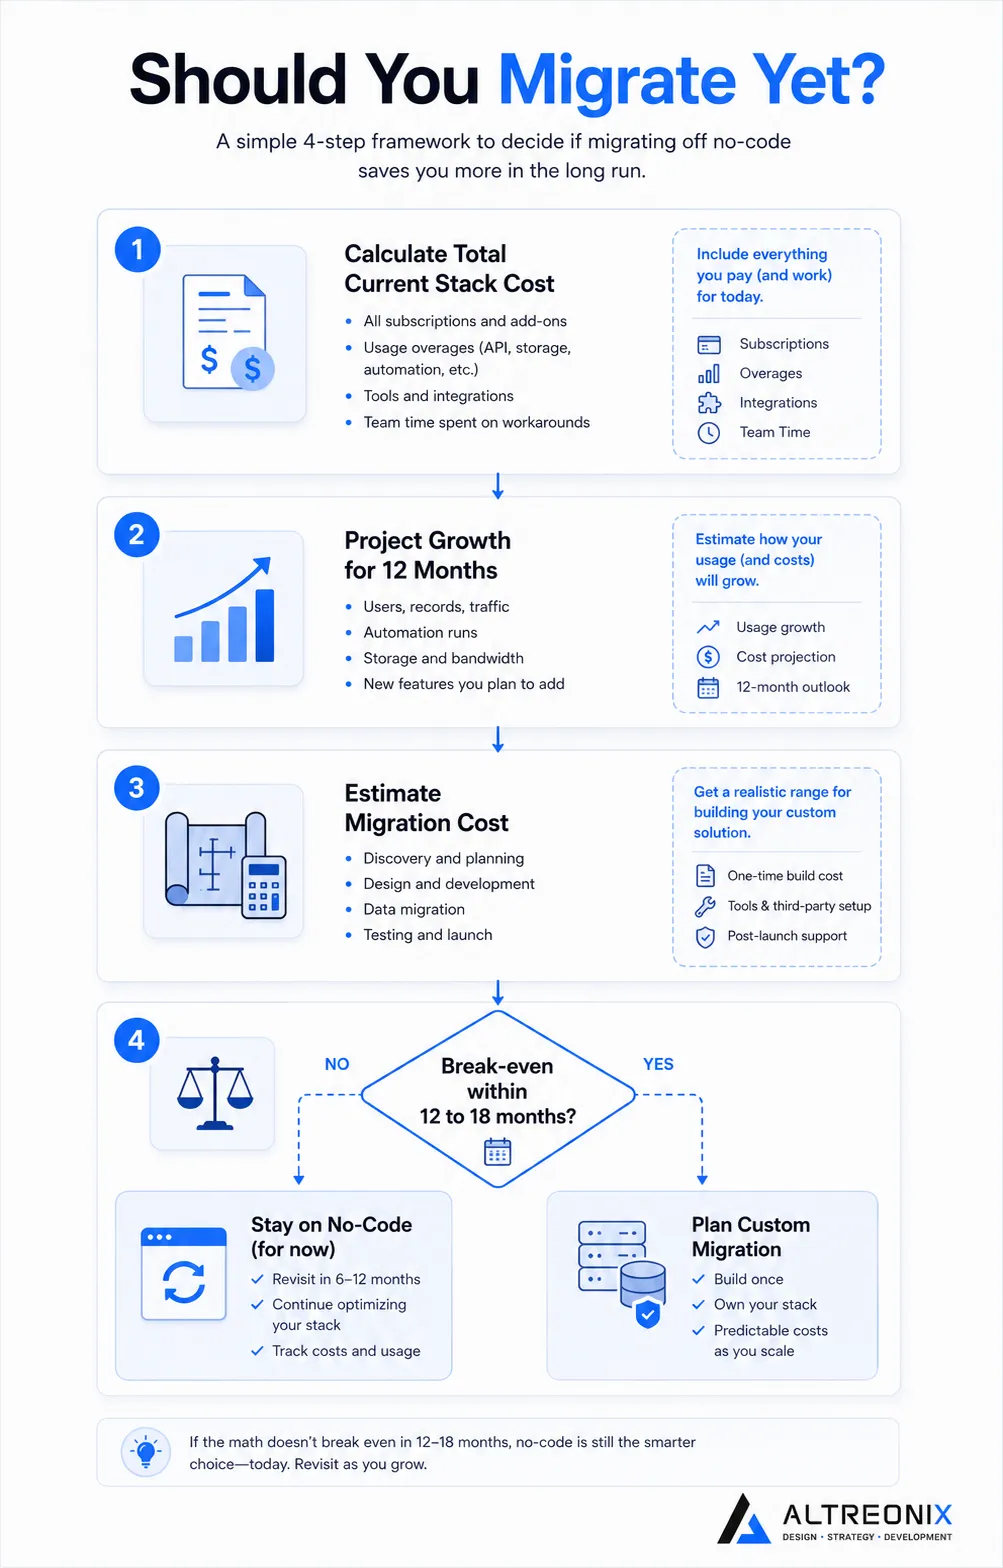
You don’t need a consultant to get a rough answer here, you need your own invoices and about twenty minutes.
| Step | What to pull |
|---|---|
| 1. Total your current stack | Every tool touching your no-code app, not just the core platform’s own bill |
| 2. Project 12 months forward | Apply your actual usage growth rate, not a flat assumption |
| 3. Compare to migration ranges above | Match your app’s complexity to the closest cost band |
| 4. Estimate your own crossover point | Divide the migration cost by your monthly savings once flat custom hosting replaces usage-based fees |
If that crossover point lands inside twelve to eighteen months, the math is telling you something concrete, not abstract. If it lands past two or three years, or you can’t project meaningful growth at all, staying put is the financially sound call, at least for now.
 ## How We Think About This at Altreonix
When we scope a migration, the first deliverable is this exact math, run against a client’s actual invoices and actual usage trend, not a generic industry benchmark. Sometimes that math says wait. Our Web Applications and Business Systems work is built around giving you that honest number before recommending anything.
If you want a real crossover-point calculation for your own stack, that’s a reasonable place to start a conversation with us.